Chapter 2: Bollinger Bands – The indicators
Date: 11 Sept 2024

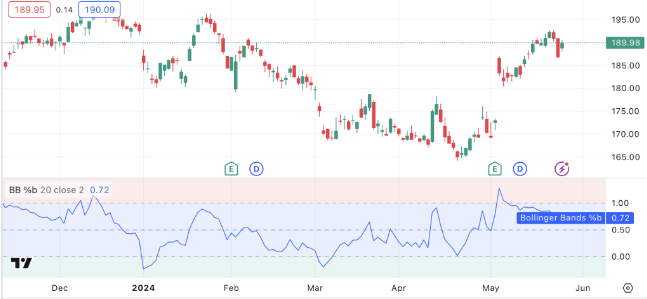
This chapter delves into two important indicators derived from Bollinger Bands: %B and Band Width. %B represents the position of the price relative to the bands, providing insights into whether a security is overbought or oversold. Band Width measures the difference between the upper and lower bands, offering a gauge of market volatility. Bollinger explains how these
indicators work in conjunction with Bollinger Bands to give traders a more nuanced view of the market.
Analysis:
The introduction of %B and Band Width enhances the utility of Bollinger Bands by adding layers of analytical depth. %B allows traders to quantify the relative position of price within the bands, which can be crucial for identifying potential trading opportunities. For example, when %B is close to 1, it suggests that the price is near the upper band, possibly indicating an overbought condition. Conversely, a %B near 0 suggests an oversold condition. Band Width, on the other hand, is a direct measure of volatility. When Band Width contracts, it often precedes a significant price move, known as a “squeeze,” which Bollinger discusses in detail in the following chapters.
Key Takeaways:
Ψ %B Indicator: Provides a standardized way to assess the position of price relative to the Bollinger Bands, offering insights into potential overbought or oversold conditions.
Ψ Band Width Indicator: Measures the width of the bands and serves as a proxy for market volatility, helping traders anticipate breakouts and significant price movements.
Ψ Enhanced Analysis: Combining %B and Band Width with Bollinger Bands allows for a more comprehensive analysis of market conditions.
Relevance in Today’s Scenario:
In the current trading landscape, where data-driven strategies dominate, %B and Band Width are valuable tools for quantifying market conditions. For example, in highly volatile assets like cryptocurrencies or tech stocks, these indicators can provide early warning signs of potential breakouts or trend reversals. The ability to measure volatility and price position with precision
makes these indicators indispensable in modern trading strategies.

Leave a comment