Episode 2: Simple Moving Average (SMA)
Date: 24 Sept 2024
When I first started trading, I was overwhelmed by the sheer number of indicators and tools available. I tried to use them all, hoping that more information would lead to better decisions. But instead, I found myself paralyzed by analysis. It was during this period of frustration that I stumbled upon the Simple Moving Average (SMA). Unlike the other indicators I had been using, the SMA was straightforward and easy to understand. I decided to strip my charts of everything except the SMA, and that is when things
started to change. Suddenly, the market made sense. The chaos of price fluctuations began to smooth out, revealing clear trends that I could follow. It was a breakthrough moment—a reminder that sometimes, simplicity is the key to success.
Welcome to the second episode of our deep dive into moving averages. In this episode, we focus on the Simple Moving Average (SMA)—a tool that is both fundamental and powerful in the world of trading. The SMA is often the first type of moving average that traders learn, and for good reason. Its simplicity belies its effectiveness in helping traders identify trends, spot reversals, and make informed trading decisions. As we journey through this episode, you will gain a thorough understanding of how the SMA works, how
to calculate it, and, most importantly, how to apply it to your trading strategies.
Disclaimer:
The information provided in this series is for educational purposes only and should not be considered financial advice. Trading and investing involve risk, and it is important to conduct thorough research or consult with a financial advisor before making any decisions. The strategies discussed are not guaranteed to yield profits and should be applied with careful consideration of your individual financial situation.
Understanding SMA: Basics and Calculation
The Simple Moving Average (SMA) is exactly what its name implies—a simple average of a security’s price over a specific number of periods. The SMA is calculated by adding up the closing prices of an asset over a given time frame and then dividing the sum by the number of periods.
For example, to calculate a 10day SMA for a stock, you would add up the closing prices of the stock for the last 10 days and then divide that sum by 10. The result is a single data point that represents the average price over those 10 days. This calculation is repeated for each new day, creating a moving average line that smooths out the short-term fluctuations in price, making it easier to see the overall trend.
Key Terms:
Ψ Time Period: The number of periods (days, hours, etc.) used in the calculation of the SMA.
Ψ Data Points: The individual prices (usually closing prices) used in the calculation.
Ψ Smoothing Effect: The process by which the SMA reduces short term volatility, making the underlying trend more visible.
Visual Example:
Imagine you are analyzing the stock of Infosys Ltd. Using a 50day SMA, you plot the average closing prices over the last 50 days on a chart. The resulting line represents the average price trend, smoothing out the daily ups and downs and allowing you to see whether the stock is generally trending up, down, or sideways.
2.1 How to Use SMA in Trading
Identifying Trends: The SMA is particularly useful for identifying trends. By averaging out short term fluctuations, the SMA reveals the underlying direction of the market. Different timeframes provide different
insights:
20day SMA: Useful for identifying short term trends. Traders often use this to gauge the immediate direction of the market.
50day SMA: This medium-term average helps in identifying the overall trend while filtering out short term noise.
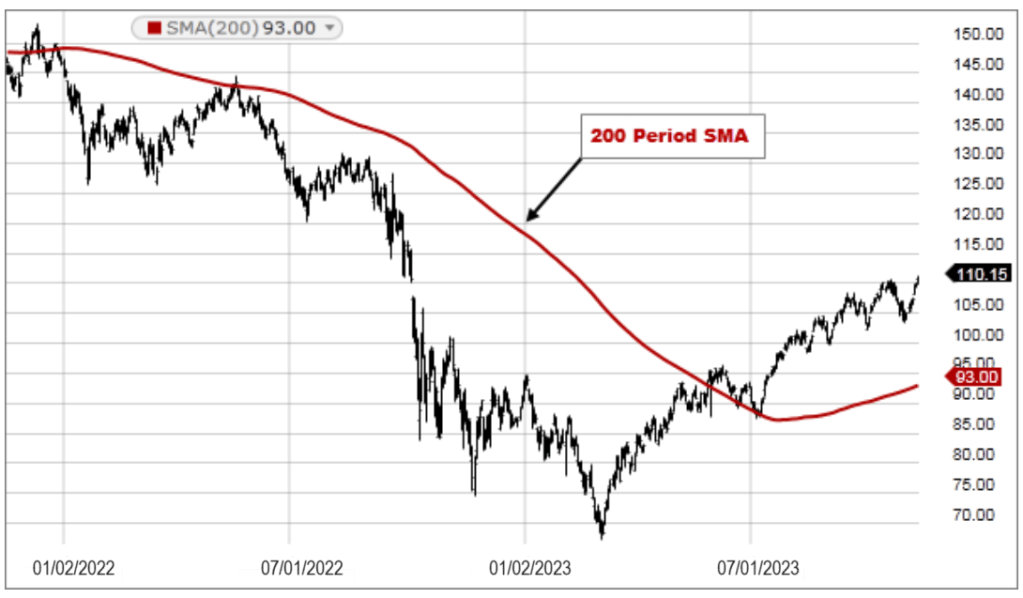
200day SMA: Often used to identify long term trends, the 200day SMA is a key indicator for long term investors and is frequently cited in financial news.
For instance, if the price of a stock is consistently above its 50day SMA, it suggests a medium-term uptrend, indicating that the stock is generally moving higher.
Spotting Reversals:
The SMA can also be a powerful tool for spotting potential trend reversals. A common strategy is to watch for the price crossing above or below the SMA.
Price Crossing Above SMA: This might indicate a potential uptrend or reversal from a downtrend.
Price Crossing Below SMA: Conversely, this could signal the beginning of a downtrend or a reversal from an uptrend.
For example, if a stock price crosses below its 50day SMA, it could be a warning sign of a potential downturn, signaling traders to consider selling or tightening their stop losses.
Support and Resistance Levels:
In trending markets, the SMA often acts as dynamic support or resistance.
Support in an Uptrend: During an uptrend, the SMA can act as a floor, where the price tends to bounce off and continue higher.
Resistance in a Downtrend: In a downtrend, the SMA can act as a ceiling, where the price struggles to break through and continues to fall.
For instance, in an uptrend, the 50day SMA might act as support for a stock. If the stock price touches the SMA and bounces back up, it reinforces the SMA’s role as a support level.
2.2 Common Timeframes for SMA
Detailed Discussion on Timeframes: Different timeframes for SMA provide different insights:
- 10day SMA: Captures short term trends, often used by day traders or those with a shorter investment horizon.
- 50day SMA: This is a common choice for swing traders and those looking to capture medium term trends.
- 200day SMA: The 200day SMA is widely used by long term investors to gauge the overall market trend and is considered a critical level of support or resistance.
2.3 Choosing the Right Timeframe:
Selecting the appropriate timeframe depends on your trading style:
Day Traders: Might prefer the 10day or even shorter SMAs to react quickly to market movements.
Swing Traders: Often rely on the 50day SMA to balance between capturing trends and avoiding too much noise.
Long term Investors: The 200day SMA is their go to for identifying major trends and making strategic investment decisions.
2.4 Advantages and Disadvantages of SMA
Advantages:
Simplicity: The SMA is easy to calculate and understand, making it accessible to traders of all levels.
Trend Identification: It effectively highlights the overall trend by smoothing out price fluctuations.
Disadvantages:
≠ Lagging Nature: The SMA is a lagging indicator, meaning it tends to react slower to recent price changes, which can delay decision making in fastmoving markets.
≠ False Signals: In volatile markets, the SMA can produce false signals, where the price crosses the SMA line but quickly reverses, leading to potential losses.
2.5 Case Studies: Successful Use of SMA in Trading
Historical Case Study: Infosys Ltd. Let us look at Infosys Ltd. in the Indian stock market. During a particular period, the 50day SMA acted as a strong support level, with the stock price bouncing off the SMA multiple times before continuing its upward trajectory. Traders who recognized this pattern were able to enter trades at these support levels, enjoying significant gains as the stock continued to rise.
Analysis and Lessons:
Entry Point: Buying when the price touches the 50day SMA during an uptrend.
Exit Point: Selling when the price crosses below the 50day SMA or reaches a predefined profit target.
This case underscores the importance of understanding how the SMA can guide entry and exit points in a trending market.
Conclusion:
The Simple Moving Average is more than just a basic tool—it’s a powerful ally in the world of trading. By mastering the SMA, you can gain valuable insights into market trends, spot potential reversals, and make informed trading decisions. Whether you are a day trader or a long-term investor, the SMA offers something for everyone, making it a cornerstone of any trading strategy.
Teaser for Next Episode:
In the next episode, we will explore the Exponential Moving Average (EMA)—a more responsive alternative to the SMA. We will dive into how the EMA is calculated, its advantages and disadvantages, and how it can be used to refine your trading strategy. Don’t miss out on the next step in your journey to mastering moving averages!

Leave a comment