Episode 3: Supercharging Your Trades with Exponential Moving Averages (EMA)
Date: 26 Sept 2024
Welcome to the third episode in our series on Moving Averages, where we delve into the Exponential Moving Average (EMA)—a dynamic and responsive variation of the Simple Moving Average (SMA). If you have already familiarized yourself with the basics of moving averages, the EMA is the next tool you will want to master. Traders often favor the EMA for its ability to respond more quickly to recent price movements, making it particularly useful in fastmoving markets. In this episode, we will break down the mechanics of the EMA, explore how it differs from the SMA, and demonstrate how you can incorporate it into your trading strategy to gain an edge in the market.
Disclaimer:
As always, the information presented in this series is for educational purposes only and should not be considered financial advice. Trading and investing involve risks, and it’s important to consult with a financial advisor and conduct your own research before making any investment decisions. While the strategies and examples discussed can offer insights, they do not guarantee success in trading.
Story: The Moment of Realization
Early in my trading career, I was fixated on the Simple Moving Average (SMA) for my analyses. However, in fastmoving markets, I often found myself lagging, unable to catch turning points in time. It was during one volatile trading session with a fastmoving stock that I realized the limitations of the SMA. The price reversed sharply, and my SMA was too slow to signal the change. That is when I turned to the Exponential Moving Average (EMA). The difference was night and day—suddenly, I could see the market
shifts earlier. That experience opened my eyes to the power of the EMA, particularly in volatile environments where speed matters.
Understanding EMA: Basics and Calculation
The Exponential Moving Average (EMA) gives greater weight to recent price data, making it more responsive to new information compared to the SMA. While the SMA treats all data points equally, the EMA emphasizes the most recent prices, allowing it to react more quickly to market changes. This makes
the EMA particularly valuable in fastmoving or volatile markets where traders need timely signals.
The formula for the EMA involves two components:
- Multiplier: This is a constant that determines how much weight recent data points will carry. It is calculated as:
Multiplier = 2
n + 1
where n is the number of periods in the EMA.
- EMA Calculation: The EMA for the current period is calculated as:
EMA = {Current Price} {Previous EMA} \right) X {Multiplier} + {Previous EMA}
Practical Example:
Let us say you’re calculating a 10day EMA for a stock. You would first calculate the 10day SMA as the starting point, then apply the EMA formula to the subsequent price data. The result is a moving average that responds more quickly to changes in the stock’s price, helping you spot shifts earlier than with an SMA.
Differences Between SMA and EMA
While both the SMA and EMA are used to smooth price data, the key difference lies in how quickly they react to price changes. The EMA assigns more weight to recent prices, making it more sensitive to new information, while the SMA provides a more stable but slower moving trend line.
Scenario 1: Fast Moving Markets: In markets with high volatility or rapid price changes, the EMA can provide more timely signals, allowing traders to act faster.
Scenario 2: Stable Markets: In slower, less volatile markets, the SMA may be preferable as it offers a smoother, more stable trend line.
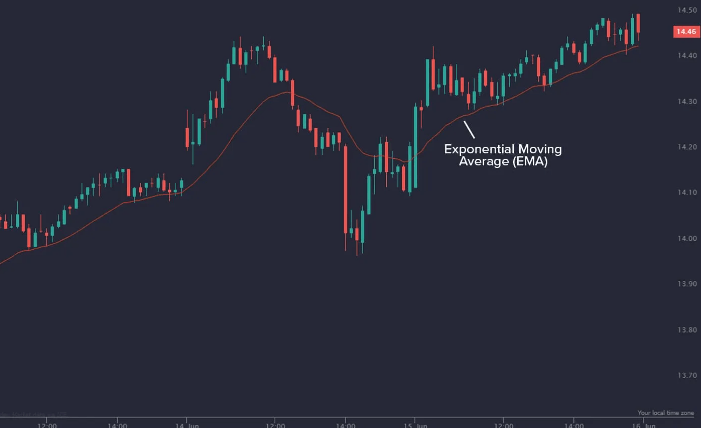
Visual Comparison:
Imagine plotting the SMA and EMA for the stock . During periods of sharp price movements, you will notice that the EMA adjusts more quickly, giving earlier signals of a potential trend change, while the SMA lags. This visual difference highlights the EMA’s advantage in fastmoving markets.
How to Use EMA in Trading
Short term vs. Long term EMA:
Short term EMAs (e.g., 9day): These are often used by day traders or swing traders to capture quick trading signals. A 9day EMA might be used to spot short term momentum shifts in stocks like Infosys or Adani Enterprises.
Long term EMAs (e.g., 50day, 100day): Longer EMAs are useful for identifying broader trends. For example, a 50day EMA on the Nifty 50 Index can help identify the overall market trend, while the 100day EMA might be used by long term investors to determine the health of a stock over time.
Identifying Trends with EMA:
One of the most powerful features of the EMA is its ability to provide early signals of trend changes. For example, when the price of a stock crosses above its short-term EMA, it might indicate the start of an uptrend. Conversely, a price drops below the EMA could signal a reversal or downtrend.
Many traders use multiple EMAs (e.g., a 9day EMA and a 21day EMA) to filter out noise and confirm trends. When the shorter EMA crosses above the longer EMA, it is often seen as a buy signal, while a cross below is viewed as a sell signal.
EMA as a Dynamic Support/Resistance:
The EMA can act as dynamic support or resistance in trending markets. For instance:
Support: In an uptrend, the EMA often serves as a support level where prices tend to bounce off.
Resistance: In a downtrend, the EMA can act as a ceiling that prices struggle to break through.
In the case of a stock, during a strong uptrend, the 50day EMA might serve as a support level, where the price repeatedly bounces off the EMA before continuing higher. In a downtrend, the EMA may act as resistance, with prices failing to rise above it.
Advantages and Disadvantages of EMA
Advantages:
→ Greater Sensitivity to Recent Price Movements: The EMA reacts more quickly to recent price changes, making it ideal for traders who need timely signals.
→ More Timely Signals in Volatile Markets: In fastmoving markets, the EMA can provide earlier trend reversal signals, allowing traders to enter or exit trades more quickly.
Disadvantages:
→ Susceptibility to False Signals: The increased sensitivity of the EMA can sometimes result in false signals, particularly in choppy or sideways markets.
→ Complexity Compared to SMA: The EMA’s calculation is more complex than the SMA, which can make it harder for beginners to fully grasp its mechanics.
Conclusion:
The Exponential Moving Average (EMA) is a versatile and powerful tool that can provide traders with early signals in fastmoving markets. By understanding how the EMA differs from the SMA and learning how to use it effectively, traders can gain a significant advantage in identifying trends, spotting reversals, and making timely trading decisions. Whether you’re a day trader or a long-term investor, the EMA can be a valuable addition to your trading toolkit.
Teaser for Next Episode:
In the next episode, we will explore the Weighted Moving Average (WMA)—another variation of the moving average that offers its own unique benefits. We will dive into how the WMA differs from both the SMA and EMA, and how it can be applied to your trading strategies. Don’t miss out as we continue our journey through the world of moving averages!

Leave a comment