Episode 4: Weighted Moving Average (WMA)
Date: 01 Oct 2024
I remember a time when I was struggling with the limitations of both the SMA and EMA. The SMA felt too `slow to capture rapid market changes, while the EMA’s sensitivity to price fluctuations was overwhelming during sideways markets. One day, a colleague introduced me to the Weighted Moving Average (WMA), explaining that it balanced the strengths of both the SMA and EMA by assigning greater weight to recent prices without the excessive noise. Intrigued, I began using the WMA to analyze the Nifty 50 during a volatile period. Almost immediately, I saw how the WMA responded better to the market’s movements, giving me clearer signals. That was a game changing moment for me as a trader, and I’ve relied on the WMA ever since.
Disclaimer:
The content provided in this episode is for educational purposes only and should not be considered financial advice. Trading and investing involve risks, and it is crucial to consult with a financial advisor or conduct thorough research before making any financial decisions. The strategies discussed here do not guarantee success and should be applied with care.
Welcome to the fourth episode in our series on Moving Averages. In this episode, we will explore the Weighted Moving Average (WMA), a variant that strikes a balance between the simplicity of the SMA and the responsiveness of the EMA. The WMA assigns different weights to different data points, giving more importance to recent prices, making it an ideal tool for traders who need to prioritize current market information. Throughout this episode, we will break down the mechanics of the WMA, its benefits, and how you can integrate it into your trading strategy for more accurate trend analysis in fastmoving markets.
Understanding WMA: Basics and Calculation
The Weighted Moving Average (WMA) assigns different weights to each data point, with more emphasis placed on recent prices. This makes the WMA more responsive to recent market changes, but less volatile than the EMA. Unlike the SMA, where all data points are treated equally, the WMA provides a weighted average, allowing traders to focus on the most relevant price movements.
The formula for WMA is as follows:
=>First, assign a weight to each data point, typically in a descending order (e.g., 10, 9, 8, 7… for a 10day WMA).
=>Multiply each price point by its assigned weight.
=>Sum the products and then divide by the total number of weights to get the WMA value.
Example:
Let us say you are calculating a 5day WMA for a stock. The closing prices for the last five days are 100, 102, 104, 103, and 105. The weights (from most recent to oldest) are 5, 4, 3, 2, and 1. Here’s how you would calculate the WMA:
- Multiply the closing prices by their respective weights:
105 × 5 = 525
103 × 4 = 412
104 × 3 = 312
102 × 2 = 204
100 × 1 = 100 - Add the products: 525 + 412 + 312 + 204 + 100 = 1553
- Divide by the sum of the weights (5 + 4 + 3 + 2 + 1 = 15):
WMA = 1553 / 15 = 103.53
In this example, the WMA is 103.53, giving more weight to the most recent price action.
Differences Between SMA, EMA, and WMA
The WMA differs from both the SMA and EMA in how it treats data points:
#SMA treats all data points equally, resulting in a smoother but slower moving average.
#EMA gives more weight to recent prices but can overreact to short term fluctuations.
#WMA strikes a balance by giving recent prices more weight but with a more gradual response than the EMA.
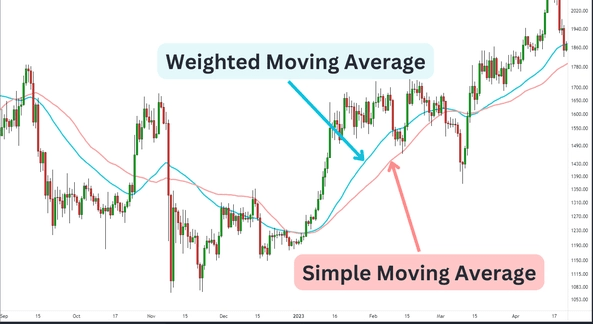
Visual Representation:
If you plot the 10day SMA, 10day EMA, and 10day WMA on the same chart, you will notice that the SMA is the smoothest but the slowest to respond. The EMA reacts the fastest, while the WMA provides a more moderate response, capturing recent price movements without overreacting to short term noise.
When to Use WMA:
Traders often prefer the WMA in markets with rapid price changes where neither the SMA nor the EMA provides the desired balance of responsiveness and stability. For instance, in a volatile stock, the WMA can provide better trend analysis by emphasizing the most recent price data while still smoothing out extreme fluctuations.
How to Use WMA in Trading
Prioritizing Recent Data: The WMA’s ability to prioritize recent data makes it particularly useful in markets where prices change rapidly. It gives traders a clearer view of the current trend, which is crucial when making short term trading decisions. For example, when trading a volatile stock , the WMA can help you quickly identify shifts in momentum by giving more weight to the latest prices.
Short term Trading Strategies:
The WMA is especially popular among day traders and swing traders. By responding more quickly to recent price changes, the WMA helps these traders spot potential trade setups faster than the SMA would.
Example Setup for Day Trading:
#Use a 10day WMA to follow the short-term trend.
#Combine with a 50day WMA to identify longer term support and resistance levels.
#Enter trades when the shorter WMA crosses above or below the longer WMA, signaling a potential trend change.
For instance, if the 10day WMA crosses above the 50day WMA in a stock, this could be a buy signal, indicating that the short-term trend is turning upward.
Advantages and Disadvantages of WMA
Advantages:
- Balanced Approach: The WMA strikes a balance between the simplicity of the SMA and the responsiveness of the EMA, offering traders a versatile tool for various market conditions.
- Effective in Volatile Markets: By giving more weight to recent prices, the WMA provides timely signals in volatile markets, making it easier to navigate sharp price changes
Disadvantages:
- Complex Calculation: The WMA is more complex to calculate compared to the SMA, which can make it less accessible for beginners.
- Overfitting to Recent Data: While the WMA gives more emphasis to recent prices, this can sometimes result in overfitting, where too much importance is placed on short term fluctuations, potentially leading to false signals.
Conclusion:
The Weighted Moving Average (WMA) offers traders a versatile tool that balances the benefits of both the SMA and EMA. By emphasizing recent prices without overreacting, the WMA provides clearer trend signals in fastmoving markets. Whether you’re a day trader looking for quick opportunities or a swing trader analyzing longer term trends, mastering the WMA can give you an edge in volatile market conditions.
Teaser for Next Episode:
In the next episode, we’ll explore Moving Average Crossover Strategies, diving into one of the most popular and effective methods for identifying trend changes and potential trading opportunities. We’ll cover key strategies like the Golden Cross and Death Cross, along with advanced crossover techniques. Stay tuned for more insights on mastering moving averages!

Leave a comment