Stocks
Technical Analysis Basics
Date: 15 June 2025

Priya, a 36-year-old marketing professional, had always been interested in the stock market but struggled to make profitable trades. She often bought stocks based on news headlines and recommendations from friends, resulting in inconsistent returns. Frustrated with her results, Priya decided to attend a financial workshop to learn more about effective investment strategies.
At the workshop, Priya was introduced to technical analysis by an experienced trader. The speaker explained how technical analysis uses historical price data and market trends to predict future price movements. Intrigued by the idea, Priya decided to learn more about this analytical approach.
Priya began studying technical analysis, learning about price charts, patterns, and technical indicators. She applied these techniques to her trading strategy and soon noticed a significant improvement in her results. By understanding market trends and identifying optimal entry and exit points, Priya became a more confident and successful investor.
What is Technical Analysis?
Technical analysis involves using historical price data, charts, and technical indicators to predict future price movements of stocks. Unlike fundamental analysis, which focuses on a company’s financial health and intrinsic value, technical analysis is based on the study of price action and market trends.
Key Characteristics of Technical Analysis
1. Price Charts: Visual representations of a stock’s price movements over time.
2. Patterns: Recognizable formations on price charts that signal potential price movements.
3. Technical Indicators: Mathematical calculations based on price, volume, and other market data to help predict future price movements.
Price Charts
Price charts are the foundation of technical analysis, providing a visual representation of a stock’s price movements over time. The most common types of price charts include line charts, bar charts, and candlestick charts.
Types of Price Charts
1. Line Charts: Simple charts that plot the closing prices of a stock over a specific period, connecting the data points with a line.

2. Bar Charts: Charts that display the open, high, low, and close prices for each period, represented by vertical bars.
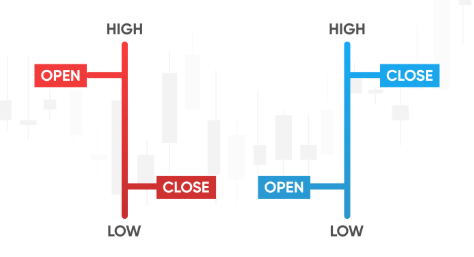
3. Candlestick Charts: Similar to bar charts but with a more visually appealing format, showing the open, high, low, and close prices for each period.

Patterns
Patterns are recognizable formations on price charts that signal potential price movements. These patterns can be categorized into reversal patterns and continuation patterns.
Key Patterns
1. Reversal Patterns: Indicate a potential change in the current trend.
- Head and Shoulders: A bearish reversal pattern signaling the end of an uptrend.

- Double Top/Bottom: Patterns indicating a potential reversal in the current trend.

2. Continuation Patterns: Suggest that the current trend is likely to continue.
- Triangles: Patterns that form as the price consolidates before breaking out in the direction of the trend.

- Flags and Pennants: Short-term continuation patterns that appear after a sharp price movement.

Technical Indicators
Technical indicators are mathematical calculations based on price, volume, and other market data. These indicators help traders identify trends, momentum, and potential reversals.
Key Technical Indicators
1. Moving Averages: Smooth out price data to identify trends and potential reversals.
- Simple Moving Average (SMA): The average price over a specific period.
- Exponential Moving Average (EMA): A moving average that gives more weight to recent prices.
2. Relative Strength Index (RSI): Measures the speed and change of price movements to identify overbought or oversold conditions.

3. Moving Average Convergence Divergence (MACD): Shows the relationship between two moving averages to identify trend changes and momentum.

4. Bollinger Bands: A volatility indicator that uses standard deviations to create upper and lower bands around a moving average.
Steps to Start Using Technical Analysis
1. Learn the Basics
Start by learning the basics of technical analysis, including price charts, patterns, and technical indicators. Familiarize yourself with different types of charts and key patterns.
2. Use Charting Tools
Use charting tools and software to analyze price movements and identify patterns. Many online platforms offer free charting tools with various technical indicators.
3. Apply Technical Indicators
Incorporate technical indicators like moving averages, RSI, MACD, and Bollinger Bands into your analysis. These indicators can help you identify trends, momentum, and potential reversals.
4. Practice and Refine
Practice using technical analysis on historical price data to refine your skills. Analyze past price movements and patterns to understand how they relate to future price movements.
5. Combine with Fundamental Analysis
Combine technical analysis with fundamental analysis to make well-rounded investment decisions. Use technical analysis to identify entry and exit points and fundamental analysis to evaluate the company’s financial health.
Conclusion
Understanding and applying technical analysis is essential for making informed trading decisions. By learning to read price charts, identify patterns, and use technical indicators, you can gain a deeper understanding of market trends and price movements. Avoiding the pitfalls of investing without technical analysis, as seen in Vikram’s story, can lead to better trading outcomes and increased profitability.
Disclaimer: The examples provided are for illustrative purposes only and do not constitute a recommendation to buy or sell any stocks. Investing involves risks, and it is important to conduct thorough research or consult with a financial advisor before making any investment decisions.
In our next episode, we will explore “Fundamental Analysis Basics,”. Stay tuned as we continue to guide you through the dynamic world of investment.
Remember, informed investing is the key to financial success. Let’s continue this journey together and unlock the full potential of your financial future.

Leave a comment